Recently, I have been working as a writer in a computer lab where visualization software is designed.
With the over-abundance of information, visualizations can make targeted pieces of information easier and clearer for the reader to instantly comprehend. This particular software mines a large database of information and displays what you tell it to find in a visual format.
For example:
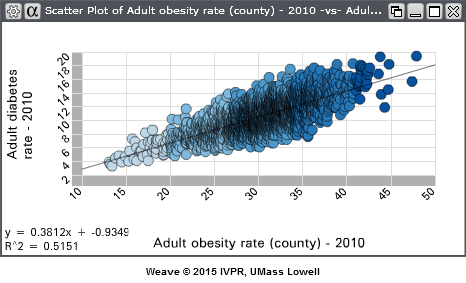 Fig. 1 Scatter plot of Obesity vs. Age
This is a scatter plot of obesity rates vs. age. Even without a lot of explanatory text, you can see that as people get older, the rate of obesity increases. This is not exactly earth shattering information until you compare this graph with graphs from earlier years and then you’ll see that with each successive year, obesity starts affecting a younger and younger demographic.
I’m fortunate, because I find this use of visualization fascinating and I love nothing more than “going…
View original post 659 more words

